Canada’s Tariff Strike Leaves US States Bleeding — Here’s Where It Hurts Most
Canada's counter-tariffs aren't aimed at Washington — they're targeting the lawmakers who support Trump's tariffs, state by state. Four charts reveal the surgical cruelty of the strategy and the supply-chain tremors shaking North America.
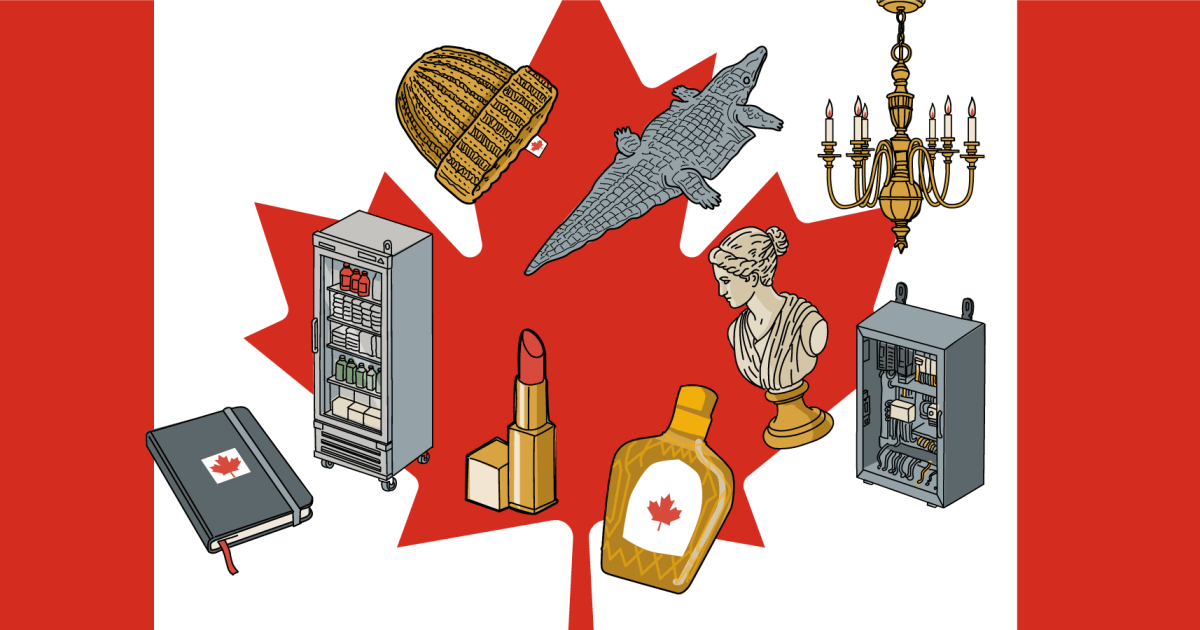
The Strike Zone Isn’t Ottawa. It’s Ohio, Michigan, and Wisconsin.
Canada’s retaliation against US tariffs has been studied carefully. The Canadian government didn’t fire blindly. Its list of targeted US products — worth roughly C$17.5 billion in retaliatory duties — maps almost perfectly onto the districts of Republican lawmakers who have backed the Trump administration’s tariff agenda. This isn’t accidental. It’s political arithmetic dressed as trade policy.
What four charts from NBC News make clear is that the trade war has moved past rhetoric into concrete, calculable damage. And the damage is asymmetric in ways that will shape the next phase of this conflict.
Chart One: The Tariff Wall Grew Overnight
The first visual shows the effective tariff rate on Canadian exports to the US jumping from near zero to roughly 25% on many goods — a rate Trump demanded as part of his broader tariff campaign. The timing is significant. This wasn’t a gradual escalation. It was a switch flipped. The US cited national security concerns over border enforcement and fentanyl, arguing that unchecked cross-border movement justified economic coercion. Canada called it economic bullying. Both descriptions are accurate; neither captures the full picture.
The 25% rate is steep enough to reshape trade flows immediately. It’s not a negotiating lever — it’s a structural barrier. For commodities like aluminum and steel, which flow freely across the border under normal conditions, this represents a fundamental disruption of one of the world’s most integrated manufacturing ecosystems. An auto part manufactured in Ontario crosses into Michigan five times before the car is finished. Each crossing now carries a tax.
Chart Two: Canada Fights Back With Precision
The second chart details Canada’s counter-list. Instead of blanket retaliation, Ottawa targeted goods produced in states represented by senators and representatives who supported the US tariff position. Whiskey from Kentucky. Dairy from Wisconsin. Steel from Pennsylvania. The map looks like a campaign donation chart — because in a sense, it is.
The strategic brilliance here is that Canada isn’t trying to hurt the US economy broadly. It’s trying to hurt specific politicians economically. A tariff on Ontario maple syrup doesn’t move the needle for American consumers. A tariff on Pennsylvania steel does — because it threatens the jobs of the lawmakers who voted for tariffs. This is retaliation calibrated to maximize political pressure while minimizing collateral damage to Canadian consumers.
It also means the pain will be concentrated and visible, not diffuse and abstract. When workers at a steel plant in western Pennsylvania see their employer cut shifts because Canadian orders dried up, they won’t blame Prime Minister Justin Trudeau. They’ll blame the politician who voted for the trigger.
Chart Three: The Integration Problem
The third chart — and arguably the most important — shows how deeply intertwined the two economies are. The US and Canada share the world’s largest bilateral trading relationship, with roughly C$2.5 billion in goods and services crossing the border every day. That’s not trade between two separate systems. That’s one system with a line drawn through it.
When you tax that line at 25%, you aren’t just raising prices. You’re forcing a reorganization of supply chains that were built over decades. Companies don’t simply relocate overnight. But they do start planning. Suppliers begin looking for alternatives. Inventory strategies shift. The costs of disruption are front-loaded while the benefits of adaptation come later — if they come at all.
For US manufacturers that rely on Canadian inputs, the tariff is a tax on their competitiveness. A Michigan automaker paying more for Canadian aluminum can’t easily pass that cost to consumers who are already watching prices. It eats into margins or forces layoffs. Either way, the tariff achieves its stated goal of protecting US industry while simultaneously harming it.
Chart Four: Who Pays
The final chart breaks down incidence — who actually bears the cost of these tariffs. The answer, consistently, is American. Economic research on the 2018-2019 tariff episode found that US importers and consumers absorbed nearly 100% of the cost of tariffs on Chinese goods. The same pattern is repeating with Canada, except the political feedback loop is faster because the affected industries are in swing states and key voting districts rather than distant supply chains.
Canadian consumers also pay — through higher prices for US goods, including technology, agricultural products, and manufactured items. But the asymmetry is real. Canada’s economy is far smaller and more trade-dependent. A 25% tariff represents a larger percentage of Canada’s GDP than it does America’s. Yet Canada’s retaliation is designed to hurt the US politically, not economically. The calculus accepts pain at home in exchange for political pressure abroad.
What Happens Next
The charts suggest three likely trajectories. First, the immediate effect: prices rise on both sides of the border, consumers adjust, and companies scramble to find workarounds. Second, the political effect: US lawmakers in targeted states feel the pressure, creating internal friction within the coalition that supports aggressive tariff policy. Third, the legal effect: both governments face questions about whether these measures violate the USMCA, the agreement that replaced NAFTA. Canada has signaled it will pursue dispute resolution mechanisms. The US has indicated it may ignore or reinterpret the agreement’s constraints.
The most interesting variable is timing. Trump’s tariff schedule includes phased implementation and potential exemptions. Canada’s counter-tariffs are already active. If the US grants sectoral relief — to automakers, for example — Canada may hold its fire on related industries. If not, the retaliation escalates.
One thing is clear from these charts: this isn’t a temporary disagreement. It’s a renegotiation of the terms of continental trade by force. The question isn’t whether the US and Canada will reach a new equilibrium. It’s who blinks first, and what the cost of that blink looks like for the workers, politicians, and supply chains that are already feeling the pressure.