Treasury Panic: Why the 5% Yield Collision Changes Everything
US 10-year yields brushed 5% as PPI, oil, and Fed-hike odds collided. For the first time since October 2023, the benchmark sits above 4.94% intraday — and central banks holding American debt now face a problem that has no clean exit.
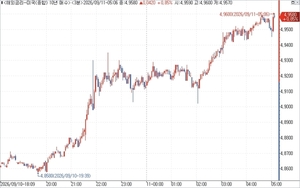
The 5% Line That Changed the Market Overnight
American Treasuries sold off in a hurry on August 10. By 3 PM Eastern, the 10-year yield had climbed 10.9 basis points to 4.944%, its highest intraday level since late October 2023. The 2-year jumped 12.3 basis points to 4.55%. The 30-year settled at 5.361%, a level not seen since June 2007.
What made the day unusual was not just the direction but the shape of the curve. The spread between the 10-year and 2-year narrowed from 40.8 basis points to 39.4 basis points — a textbook bear flattening. Short rates were running faster than long rates, which means the market was pricing immediate pain before it was pricing permanent damage. That distinction matters.
Three Shocks Hit on One Tuesday
The first came from the producer price index. The August reading matched consensus at a 0.4% month-over-month increase, but the composition told a worse story. Airlines surged 4.2%, trucking rose 2.0%, and both feed directly into the core PCE deflator — the Federal Reserve’s actual target gauge, not the headline inflation prints that dominate daily headlines.
Molly Brooks at TD Securities noted the divergence plainly: headline in line, PCE components hot. Karl Weinberg at High Frequency Economics said it even more directly — cost pressures are already airborne, and the FOMC hawks now have their ammunition.
The second shock was oil. West Texas Intermediate broke through $100 a barrel for the first time in months, closing at $102.48 after an 8.69% intraday surge. Brent had already crossed the threshold. The driver was not OPEC discipline but geopolitics. Reports that Iran-aligned Houthi forces were tightening control over the Bab el-Mandeb strait sent shipping risk premiums into the spot market. Ten consecutive days of gains, and WTI had now erased the entire discount it held to Brent during the first half of 2024.
The third shock came from the Federal Reserve’s own pricing mechanism. CME FedWatch showed the probability of a September rate hike at 73.1%, up more than 10 percentage points from the previous session. October odds climbed from the early 70s into the mid-80s. The market was not forecasting gradualism anymore.
The Buyback That Sent a Clear Signal
Perhaps the most underreported detail of the day came from the Treasury’s 30-year buyback auction. The department had announced a maximum capacity of $6 billion to support liquidity in the 10-to-20-year segment. Demand showed up at $10.489 billion. The Treasury accepted only $5.187 billion.
That shortfall — nearly half the auction capacity going unclaimed despite excess bids — was not an accident. It was a message. The Federal Home Loan Banks and primary dealers had plenty of wants; the Treasury simply did not need to clear them all at once. When an agency that normally absorbs every dollar of demand signals restraint, the market interprets it as a liquidity squeeze in waiting.
The 30-year yield bounced off its midday low and reclaimed 5.3%, suggesting the sell-off was concentrated in the front end of the curve rather than a structural repricing of risk premiums. That keeps the scenario closer to a squeeze than a crisis — for now.
Why Europe Flashed First
German Bunds moved ahead of Treasuries that morning. The 2-year yield jumped 16.29 basis points to 3.2439%, the steepest single-session move of the cycle, after the European Central Bank signaled an expected 25-basis-point rate hike and opened the door to another in October. The ECB’s forward guidance is now anchoring the entire eurozone curve higher, which in turn reinforces the dollar’s strength and tightens financial conditions for every emerging market that borrowed in dollars last year.
When Germany’s 2-year climbs that sharply alongside US short rates, it confirms that the yield shock is not America-only. It is a multi-center tightening event, and that raises the odds of a synchronized growth deceleration across the G7.
Who Wins, Who Loses, What Comes Next
The immediate winner is the dollar. Higher US yields plus a weaker energy-import profile equals sustained dollar strength heading into Q4. Foreign holders of Treasuries — Japan, China, the UK, the rest of Asia — see the mark-to-market value of their reserve positions erode in real terms. That is the invisible tax of rising rates on a flat curve.
The loser is anyone with floating-rate exposure priced in dollars. Sovereigns in East Asia and Latin America that issued in the last six months of low-rate conditions will feel the compression immediately. Corporates with near-term refinancing walls face the same dynamic. The bear flattening structure means short-term borrowing costs rise faster than long-term funding yields, which squeezes cash flows before it crushes asset values.
Next week’s FOMC meeting will be the pivot. If the dot plot and language confirm the September increase, the curve will extend higher and the dollar will push toward levels that force EM capital controls or IMF calls. If the language shifts toward caution despite the data, the 10-year will pull back toward 4.8% and the selloff reverses into a relief bounce.
The PPI data itself is not a crisis signal. It is a persistence signal. The Fed has been fighting exactly this composition — headline calm, underlying heat — for two years. Every month it repeats, the policy gap between data and rhetoric narrows. By October, if oil stays above $100 and PCE components continue their climb, there will be no room for a data-dependent pause.
Five percent on the 10-year is not a ceiling. It is a coordinate. Markets will remember where they first saw it, and they will price everything against the next time.
What English-Language Readers Miss About This Trade
Korean financial media reads Treasury curves differently than American desk commentary. The bear flattening gets attention because it is the leading indicator of domestic credit stress. When short rates outrun long rates in Seoul, corporate spreads tighten and bank funding costs spike — exactly the sequence that triggered emergency interventions during the 2022 won crisis. Korean strategists watching this curve do not see just a US policy debate. They see a template for what happens when dollar liquidity dries up and regional currencies must adjust without a lender of last resort.
The $600 million Treasury buyback acceptance rate matters more to Asian central banks than it does to US portfolio managers. It tells them whether Washington still has the willingness to absorb demand during a stress episode. When the answer is no, every Asian reserve manager recalibrates its duration exposure in treasuries by roughly one year. That is not speculation — it is the mechanical response to a liquidity signal that arrived on a Tuesday afternoon.
This is not the end of the bond bull market. It is the moment it stopped pretending it was safe to hold.