Greenland's Petermann Glacier Shows Its Fracture Lines Before Calving
New satellite radar captured months of accelerating fracture propagation before a 29-square-mile iceberg broke from Greenland's Petermann Glacier — a rare window into how fast ice shelves can deteriorate.
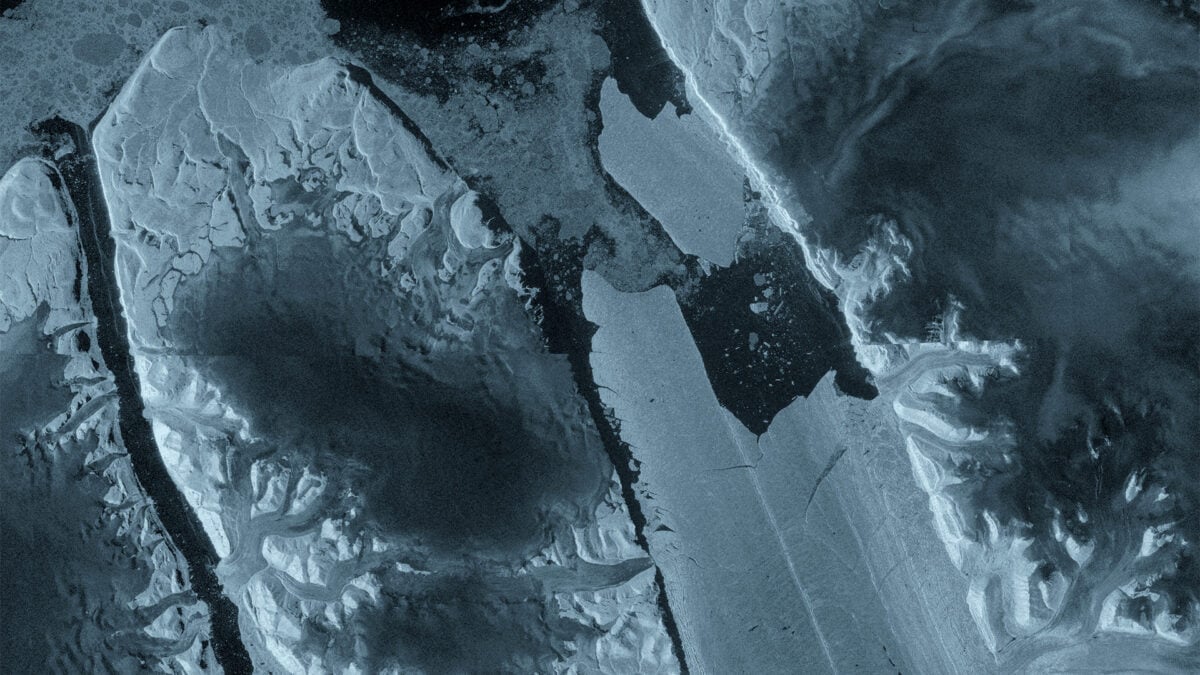
What the cracks in Petermann Glacier are telling us
For years, scientists have tracked the growth of fractures in Greenland’s Petermann Glacier from orbit. But this time, the data told a different story. In April, radar interferometry from ESA’s Sentinel-1 mission revealed that deformation was already under way inside the floating ice tongue. By August 4, a 29-square-mile slab had sheared free, leaving behind a Manhattan-sized ice island adrift in the Arctic Ocean.
The difference between this event and previous calvings is not the size alone — though 29 square miles makes it the largest loss from Petermann in over a decade — but the visibility of the process. The fractures were not a surprise appearing hours before detachment. They were propagating for months, measurable and trackable from space, offering an unusual real-time look at how rapidly a marine-terminating glacier can destabilize.
“The changes we observed were occurring very rapidly in the lead up to the iceberg calving event,” said Molly Hammond, a PhD student at the University of Leeds who processed the Sentinel-1 data. The word “rapidly” matters here. In glaciological terms, months is an eternity. Ice shelves that once took decades to fracture are now showing pronounced deterioration on seasonal timescales.
The Sentinel-1 observations captured strain accumulation well before any visible crack appeared on the glacier’s surface. Interferometric synthetic aperture radar — or InSAR — measured ground displacement by comparing the phase of radar signals collected during successive passes. The resulting fringes mapped subtle movement at millimeter resolution, revealing that the ice tongue was undergoing internal reconfiguration long before optical satellites would have shown anything unusual. This gap between subsurface deformation and surface expression is precisely what makes the dataset significant: it proves that fracture nucleation precedes obvious rupture by a substantial window, potentially offering a predictive signal if monitored consistently.
How far back this goes
Petermann has shed giants before. A 97-square-mile iceberg broke away in 2010. Another, 50 square miles, followed in 2012. The current ice tongue, which scientists have monitored since 2019, appears to be on the verge of splitting again — possibly twice more, with projected ice islands measuring roughly 36 and 32 square miles respectively, according to ESA researchers tracking existing rift propagation.
Ice islands are a distinct subclass of iceberg: flat-topped, wide relative to their height, and capable of persisting for years in the Arctic before breaking down. They are far less common than regular tabular icebergs and represent a particular hazard to maritime traffic, not because they sink ships but because they drift unpredictably across shipping lanes that are themselves changing as the Arctic opens.
The fact that radar interferometry could resolve internal deformation before visible surface cracking suggests the structural failure was well underway long before the calving became obvious in optical imagery. Sentinel-1’s synthetic aperture radar penetrates cloud cover and operates day and night, producing interferograms that map ground displacement down to the centimeter. That capability turned what was once a retrospective observation — finding out a glacier had collapsed — into something closer to a prognosis.
The longitudinal monitoring also places this event in a longer arc of change. Petermann’s 2010 and 2012 calvings were similarly preceded by fracture networks that evolved over months. What is new is the consistency with which modern satellite constellations can capture those precursors. The Copernicus program, of which Sentinel-1 is a core component, was designed precisely for this kind of systematic Earth observation. Its two-satellite configuration ensures revisit times of six to twelve days, sufficient to resolve the acceleration phase of rift propagation without the data gaps that plagued earlier missions.
Why the timing matters
Greenland’s ice sheet holds enough water to raise global sea levels by roughly seven meters if it were to melt completely. It is not going to happen overnight, but the rate at which it is losing mass is accelerating, and marine-terminating glaciers like Petermann are among the most volatile components. When warm ocean water undercuts an ice tongue from below, the floating section loses its buttressing effect on the land ice behind it. The glacier accelerates, more ice flows to the ocean, and the cycle reinforces itself.
The Sentinel-1 observations don’t prove that ocean-driven melting caused this particular calving, but they add to a growing body of evidence that the forces reshaping Greenland’s glaciers are operating on faster timelines than earlier models anticipated. The fractures visible in April may have been the surface expression of structural weakening that began much earlier, possibly driven by subsurface ocean warming.
What the data does suggest is that the mechanical thresholds for ice-shelf failure are being reached more frequently. The connection between deep-ocean temperature anomalies and surface fracture propagation remains an active area of research, but the temporal correlation between rising ocean heat content in Baffin Bay and increased calving frequency at Petermann is difficult to ignore. Warmer water reaches the grounding line — the point where the glacier lifts off the bedrock and begins to float — and undermines the structural integrity that holds the ice tongue together from below. Fractures propagate upward through the ice in response to stress redistribution, eventually reaching the surface where they become visible to optical sensors. By then, the damage is effectively irreversible.
Who is watching, and what happens next
ESA has confirmed that Petermann and the new ice island will continue to be tracked through a combination of satellite imagery, aerial observations, and movement data. The goal is not merely cataloguing losses but understanding the mechanics — what triggers fracture propagation, how quickly ice tongues deteriorate once cracks appear, and whether the remaining sections of Petermann’s floating tongue can stabilize or are locked into further breakup.
Martin Wearing of ESA noted that missions like Sentinel-1 provide the systematic, long-term observations needed to track these changes and their wider impacts on the Earth system. That framing is deliberate. Petermann is not an isolated event. It is a data point in a pattern that includes Jakobshavn, Thule, and dozens of smaller outlet glaciers all responding to the same warming signal.
The second-order effects extend well beyond sea-level projections. Thinning ice and more frequent calving alter freshwater input to the North Atlantic, potentially affecting deep-water formation and the Atlantic Meridional Overturning Circulation — the current system that distributes heat globally and moderates Europe’s climate. Even a partial slowdown in AMOC would reshape precipitation patterns across the tropics and mid-latitudes, with agricultural and ecological consequences that reach far beyond the Arctic. Opening Arctic shipping routes, meanwhile, are already drawing commercial and military interest, making the new ice island and future fragments relevant to navigation, economics, and geopolitics, not just glaciology. Ice islands that persist for years can obstruct lanes that were previously clear, and their presence complicates surveying efforts for undersea infrastructure that energy companies are planning in the region.
What is clear from the latest imagery is that the fractures were not sudden. They were gradual, measurable, and visible from space for months before the iceberg went free. The science of monitoring them has advanced. The question now is whether the information those satellites are returning is translating into faster, more accurate projections of where Greenland’s ice is heading — and whether the world is adjusting fast enough to match the pace of change. The fractures at Petermann were readable from April. Whether policymakers read them in time remains an open question.